Generating and transforming data » History » Version 3
Federico Vera, 2018-07-12 06:03
| 1 | 1 | Federico Vera | # Tour |
|---|---|---|---|
| 2 | |||
| 3 | 3 | Federico Vera | {{>toc}} |
| 4 | |||
| 5 | 1 | Federico Vera | # Adding data from `csv` |
| 6 | |||
| 7 | Adding data to `mrft` is as simple as dragging and dropping, for instance try downloading attachment:test.csv . |
||
| 8 | Once yo save it, open `mrft` and drop it over the table where you want it, the effect should be something like: |
||
| 9 | |||
| 10 | 2 | Federico Vera | <center>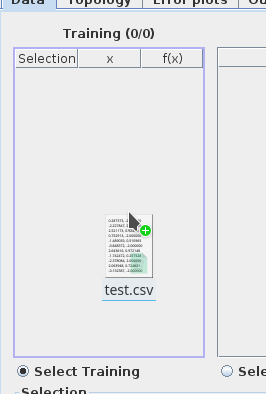</center> |
| 11 | 1 | Federico Vera | |
| 12 | # Adding data from a custom function |
||
| 13 | Adding data from a custom function is is quite simple thanks to our friends at [`exp4j`](http://www.objecthunter.net/exp4j/), there are three options for doing so (of course, as seen before, you can generate your `csv`s in whichever |
||
| 14 | way you want): |
||
| 15 | |||
| 16 | - Populating with a monospaced `x` |
||
| 17 | - Populating with a uniformly distributed random `x` |
||
| 18 | - Populating with a gaussian distributed random `x` |
||
| 19 | |||
| 20 | For more information the available functions and operators in `mrft`'s version of `exp4j` see [[Expressions|Expressions]] |
||
| 21 | |||
| 22 | ## Monospaced `x` |
||
| 23 | 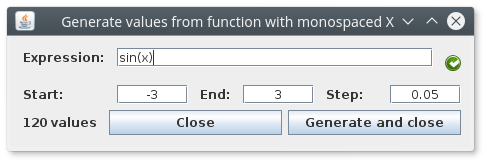 |
||
| 24 | |||
| 25 | This one is fairly easy, write your expression (one is provided in case you're lacking imagination at the moment). Select a starting point and an end point and finally which step you want to use to evaluate your expression. |
||
| 26 | |||
| 27 | ## Random (uniform) `x` |
||
| 28 | 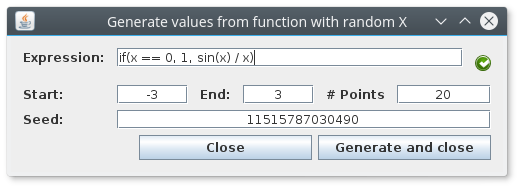 |
||
| 29 | |||
| 30 | This one is not so different, except instead of a step we use the number of random points. There's also a `seed` value that will be automatically set to `System.nanoTime()` (don't know what that is? it actually doesn't matter...). |
||
| 31 | Just know that if you use the same `seed` over and over again you'll get always the same points ([*pseudorandom*](https://en.wikipedia.org/wiki/Pseudorandomness) is a better word for the distribution of points). |
||
| 32 | |||
| 33 | ## Random (gaussian) `x` |
||
| 34 | 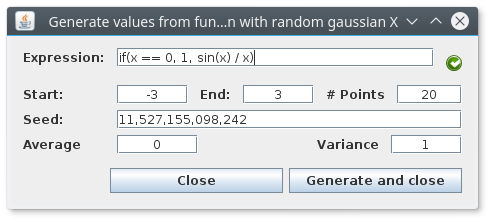 |
||
| 35 | |||
| 36 | For this one you should actually now something about [Gaussian/Normal](https://en.wikipedia.org/wiki/Normal_distribution) distributions (yeah it's a long and uninformative article), what's important is to know that the random points will be centered around the value set in `average` (so it's a good idea for `average` to be inside the interval), and that the `variance` value will tell the points how far away from the `average` they |
||
| 37 | are allowed to go, luckily, most of the points will obey this order (some rebel points might escape...). |
||
| 38 | |||
| 39 | # Moving data between tables |
||
| 40 | |||
| 41 | |||
| 42 | # Adding noise |
||
| 43 | |||
| 44 | There are several ways of adding noise to a dataset (as there are different types of noise), we'll mention the two classic noises and leave the rest for you to figure out. |
||
| 45 | |||
| 46 | - Uniform random noise (see [[Expressions|Expressions]]) |
||
| 47 | - Gaussian noise `//<- the recommended noise` |
||
| 48 | |||
| 49 | Gaussian noise will basically add (or subtract) a random amount to the data (following the same rules described in `Random (gaussian)`). |
||
| 50 | |||
| 51 | Soooooo... let's get started, load a dataset (you should know how to do this by now), and go to `Dataset->Transform...->Custom Function (All)`, you'll see something like this: |
||
| 52 | |||
| 53 | 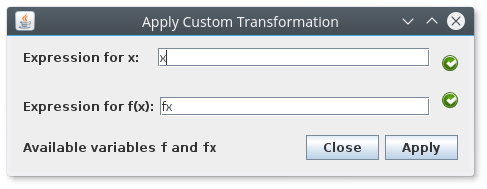 |
||
| 54 | |||
| 55 | The idea is that the expression that you write will be applied to all the elements of the dataset, so if you leave it as it is nothing will change since `x = 1*x` and `fx = 1*fx`, what is called the *identity transformation*. If you where to invert the values `x <-> fx` then everything on the first column will go to the second and vice versa. |
||
| 56 | |||
| 57 | When adding noise, we are actually only applying a transformation to `fx` so leave `x` alone for now. |
||
| 58 | |||
| 59 | Since we want the noise to be gaussian, we'll need to add an `average` and a `variance`; the most "coherent" average is `fx` itself, and the variance value will depend on the maximum and minimum values of `fx`, try and choose a variance that is at least 1 or 2 orders of magnitude less that the max value of `fx` (you can sort the table to have the largest value, and then divide that number by 100). |
||
| 60 | |||
| 61 | The name of the function is `gaussian2` (there's one called `gaussian` that uses a default value of 0 for the average and 1 for the variance). The final expression should be something like `gaussian2(fx, 0.1)` or in general `gaussian2(fx, 1 / (max(fx) * 100))` (please note that `max(fx)` isn't really a function). |
||
| 62 | |||
| 63 | # Adding more noise |
||
| 64 | |||
| 65 | Usually in a real dataset we have several values for the same `x`, we can emulate this by copying all (or some) of the data in the same table, and then adding the noise that we talk about in the previous section (the order is important, since if we copy data AFTER adding noise we are not doing nothing at all except making training slower and overfitting worst). |
||
| 66 | |||
| 67 | # About plotting noise |
||
| 68 | |||
| 69 | The ideal way of plotting noisy data is setting `Plot options->Point` instead of `Path`, that way you should see a _cloud_ of points instead of a very weird looking line. |