
Plotting functions
There are several ways of plotting mathematical functions with jdrawinglib, but the easiest way is to use Calculable and GFormula.
All the code examples assume you are using the usage template.
Import the classes
import com.dkt.graphics.exceptions.DomainException;
import com.dkt.graphics.extras.GFormula;
import com.dkt.graphics.extras.formula.Calculable;
Create a new Calculable object and implement f(x)
In our case we are implementing a simple sin(x), since all the real numbers are a part of the domain of sin(x) we won't bother with the DomainException.
Calculable calculable = new Calculable() {
    @Override
    public double f(double x) throws DomainException {
        return Math.sin(x);
    }
};
Since the image of sin(x) is the interval [-1, 1] and the domain of a period is [0, 2π] the height will be just two pixels and the width ~6 pixels, so in order to make it look nice, we'll need something like:
calculable.setScaleX(40);
calculable.setScaleY(60);
Create a GFormula and calculate it
Calculable objects are just a container for f(x) and it's scales, but the real calculation is done by GFormula. This class provides some methods to calculate paths, areas and points.
GFormula formula = new GFormula(calculable);
// Paints should be set before calling the calculate methods
// I use -π to π so the function is centered
formula.calculatePath(-Math.PI, Math.PI, 0.01);
canvas.add(formula);
Beautify it
This isn't actually necessary, but it does give a nice effect. First we'll create a GAxis object and add it to the canvas, since the axis should really be behind the graph, this could be achieved by adding the axis first, or simply adding the axis to the background of the canvas with
canvas.addFixed(GraphicE).
GAxis axis = new GAxis(-300, 300, -300, 300);
axis.drawLinesH(true);
axis.drawLinesV(true);
canvas.addFixed(axis);
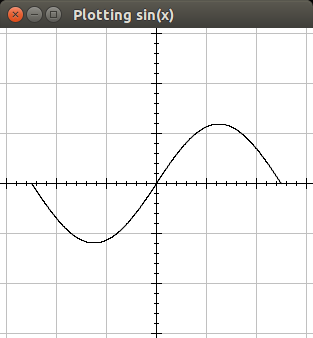
And the final result should be something like this (the final code is [here -> Plotting.java):
Beautify it some more
In the following code we'll add some color to the graph, and paint an area changing the stroke used to show the area. in order to do this we must set the Paint before calculating the path. So the code will end up:
GFormula formula = new GFormula(calculable);
formula.setPaint(Color.ORANGE); // <--
formula.calculatePath(-Math.PI, Math.PI, 0.01);
Now we need to calculate the area, lets say we want to color the area in the interval (1, 2) to that end we need a new GFormula object, since the idea is making it look nice, lets put a transparent color on the area, and a dashed Stroke. The code will be something like:
import com.dkt.graphics.utils.Utils;
import java.awt.BasicStroke;
import java.awt.Color;
import java.awt.Stroke;
// This variables aren't really necessary, but the code
// needs to be short for the wiki.
final int cap  = BasicStroke.CAP_ROUND;
final int join = BasicStroke.JOIN_ROUND;
final float[] dash = new float[] {5, 5};
Stroke stroke = new BasicStroke(1, cap, join, 0, dash, 0);
// This creates a new color with 32 as the alpha value
Color background = Utils.getColorWithAlpha(Color.GREEN, 32);
GFormula area = new GFormula(calculable);
area.setAreaPaint(background);
area.setPaint(Color.GREEN);
area.setStroke(stroke);
// Calculate the area in the interval
area.calculateArea(1, 2, 0.01);
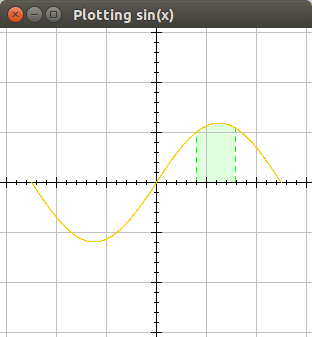
So the final code (Plotting2.java) will result in the following output:
Updated by Federico Vera about 8 years ago · 4 revisions